CONVERT, DON'T REBUILD
Turn Excel planning models
into deployable apps. Fast.
GridOps extracts structure and logic from real-world spreadsheets, helps you map it to dimensions, and generates a deployable model + input forms you can iterate on.
* Based on internal testing on complex enterprise Excel models. Results vary by model complexity and target environment.
Excel workbook → GridOps → deployable app
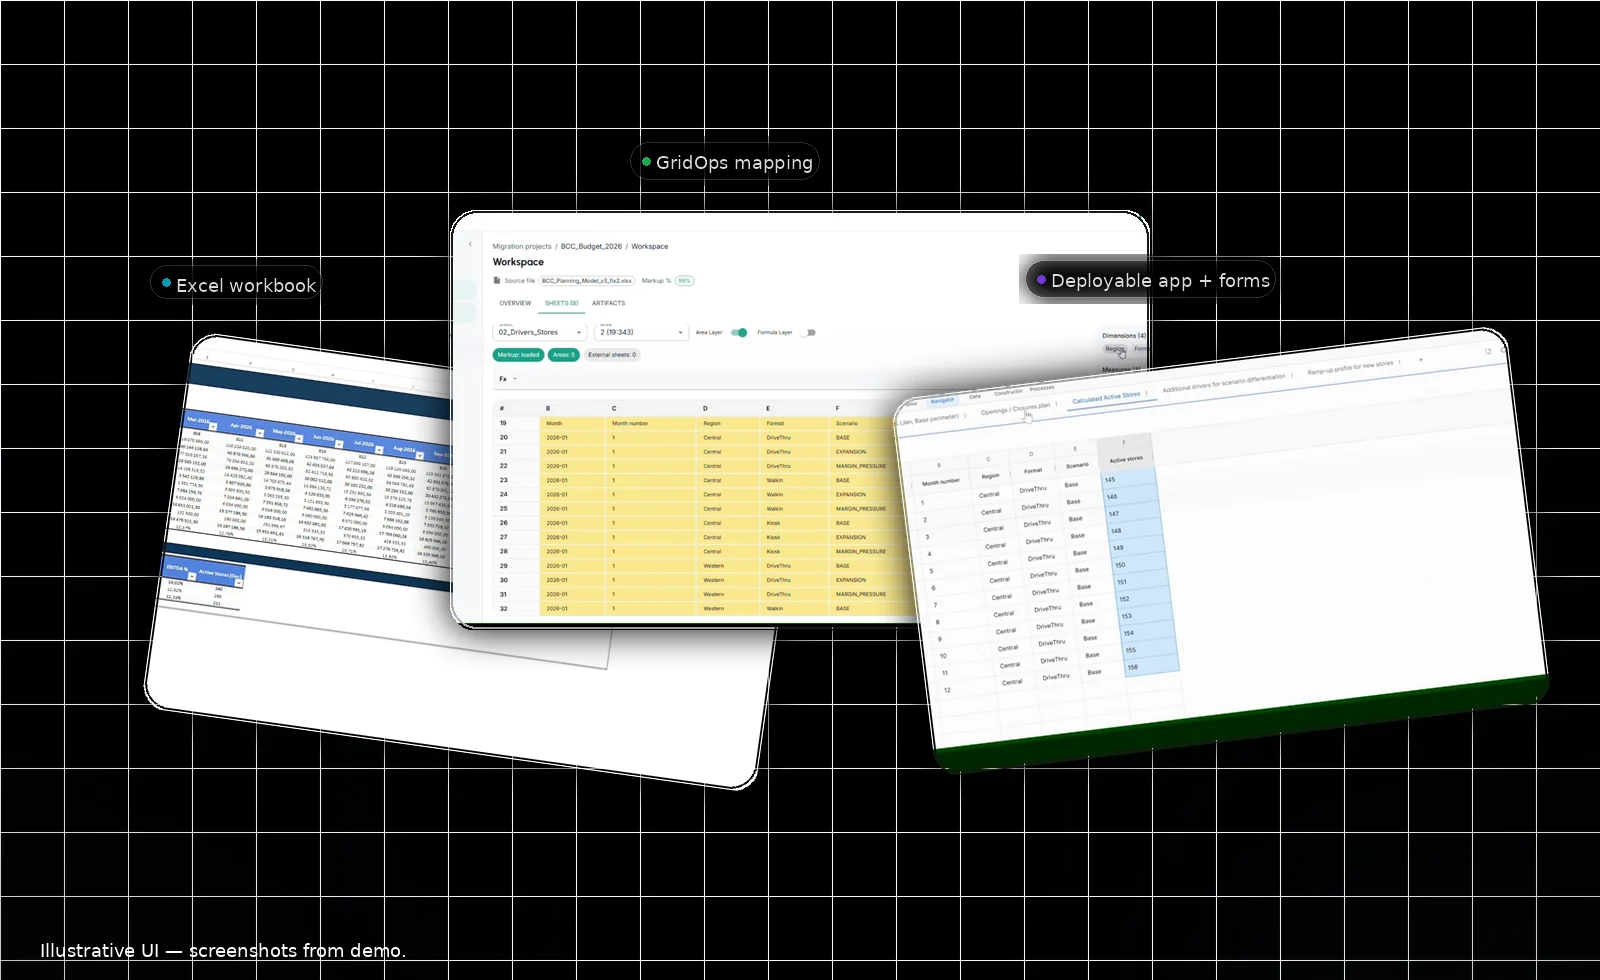
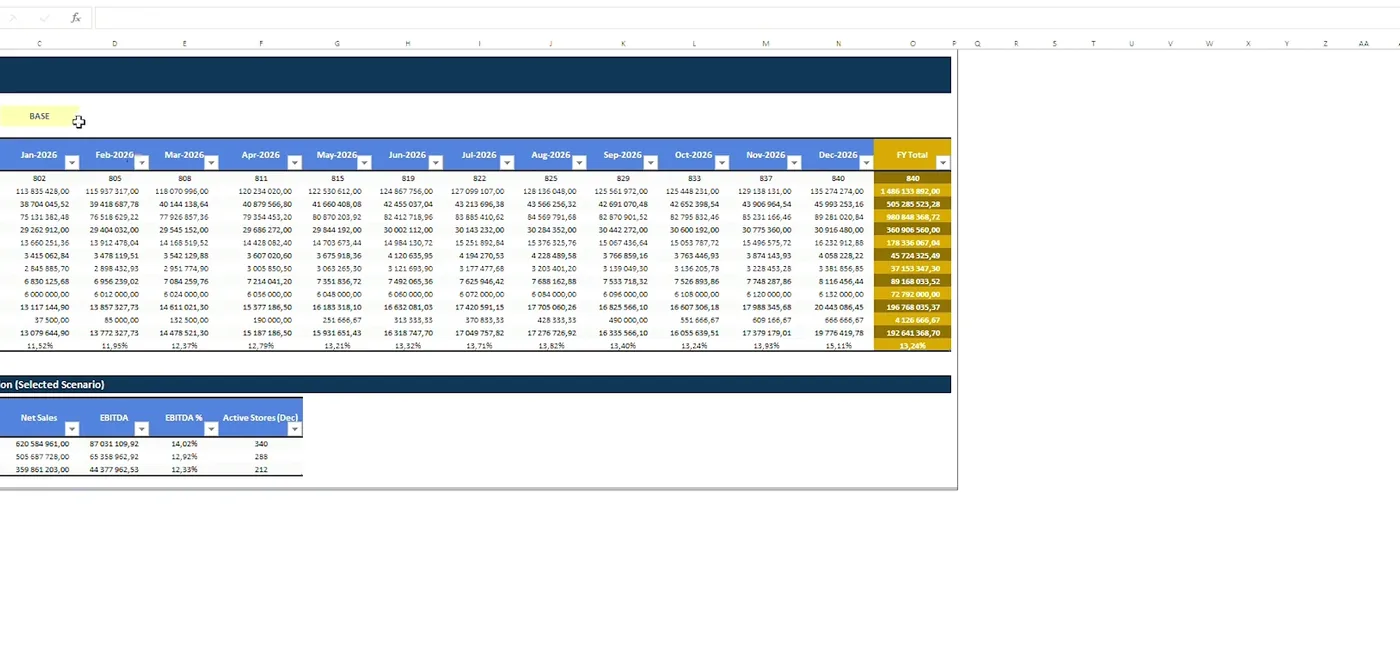
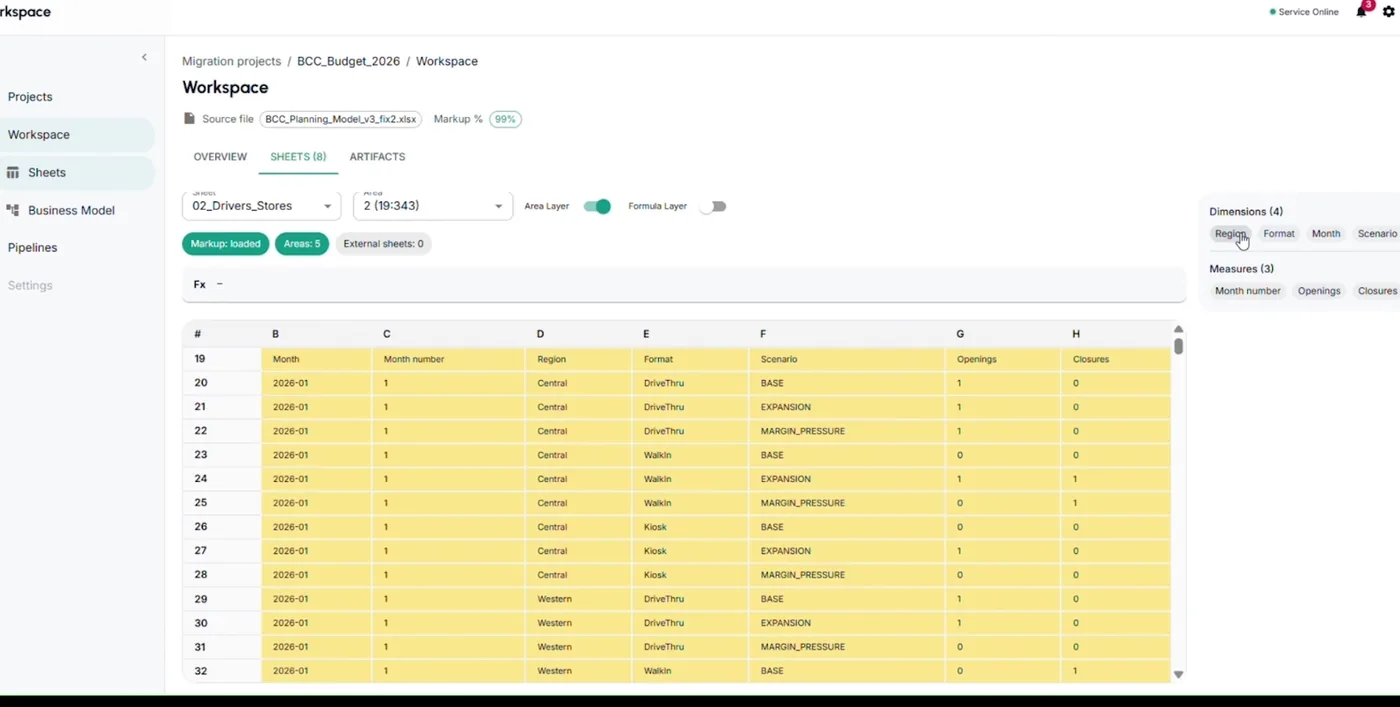
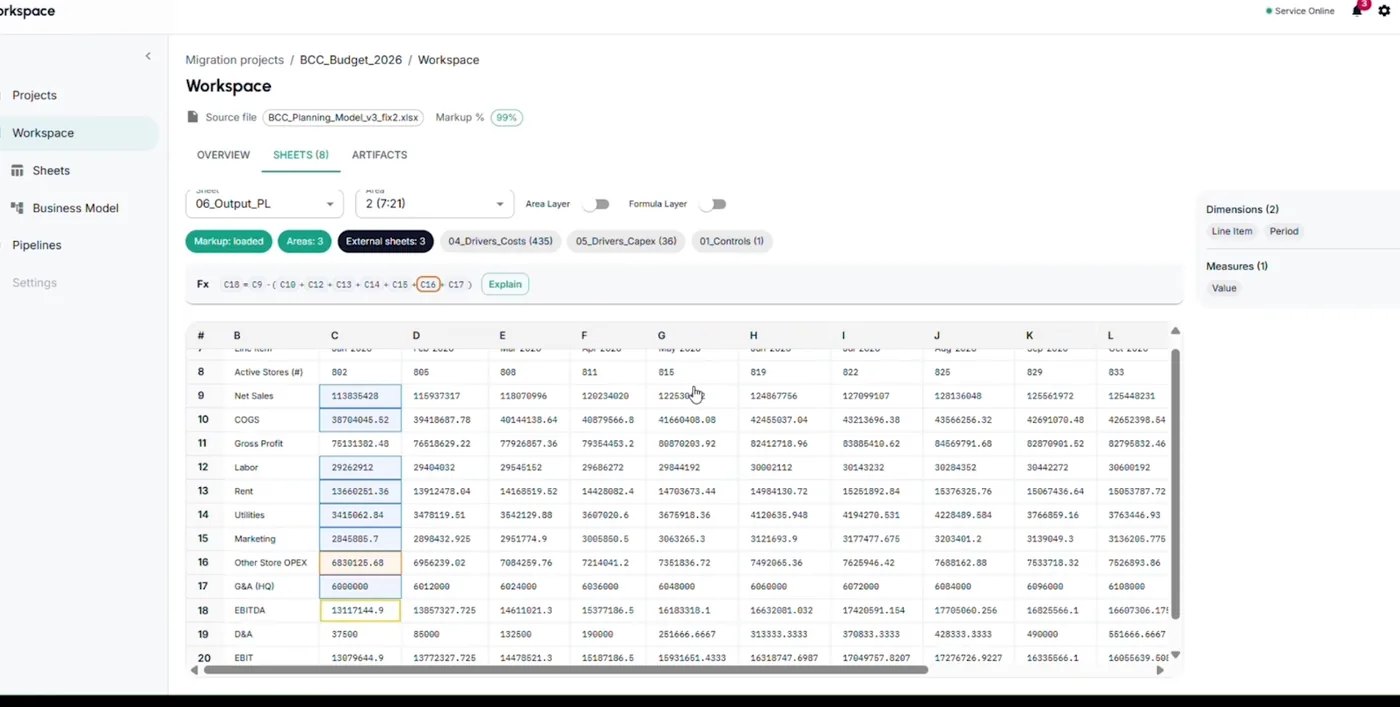
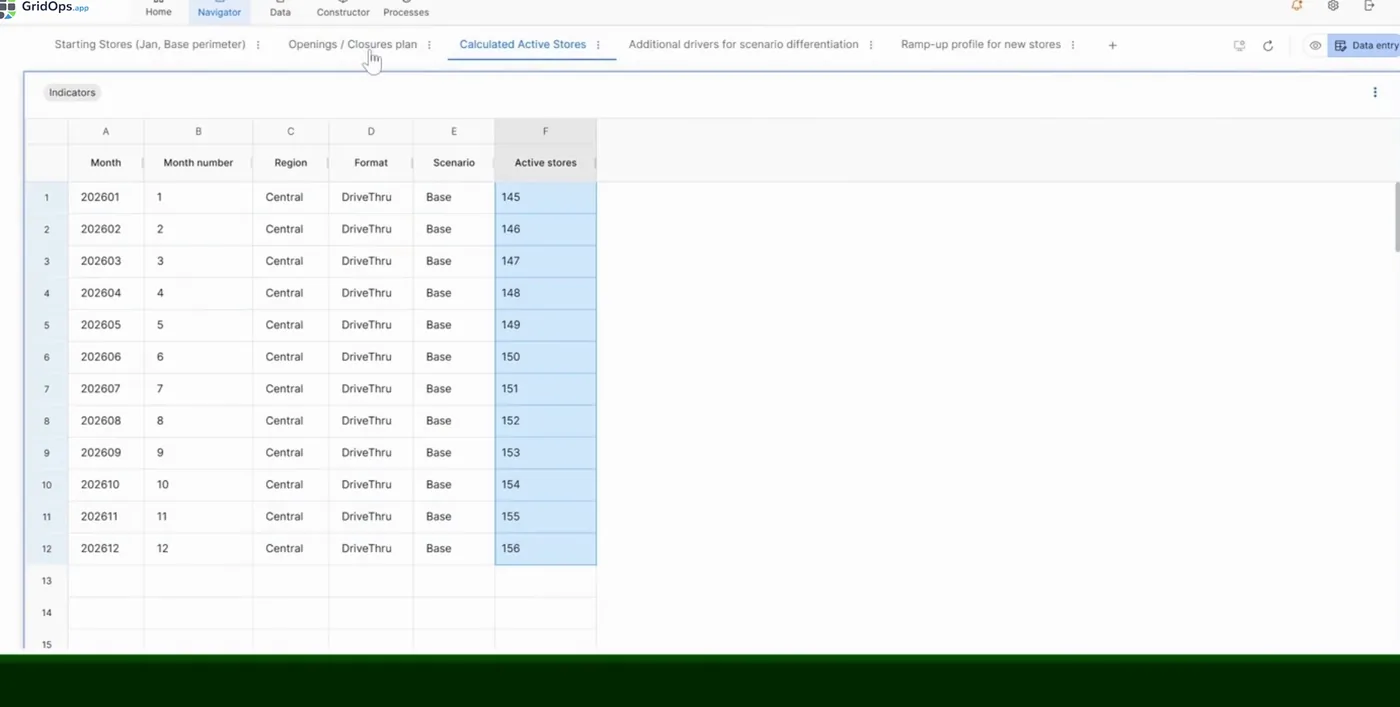
What you're seeing
Real screenshots: Excel → mapping workspace → deployed app-like views.
See product screenshots